When debugging a program it is convenient to be able to control the flow of a program, stopping it to observe variables, and restarting it. A breakpoint is a line which will cause the program to stop when it is reached. This line will not be executed when the program stops. When the program stops control is passed back to the debugger process. The debugger used by ebe is gdb. Normally when gdb stops it allows the user to type in commands. When it stops at a breakpoint in ebe, control is given back to ebe and ebe sends the commands to gdb.
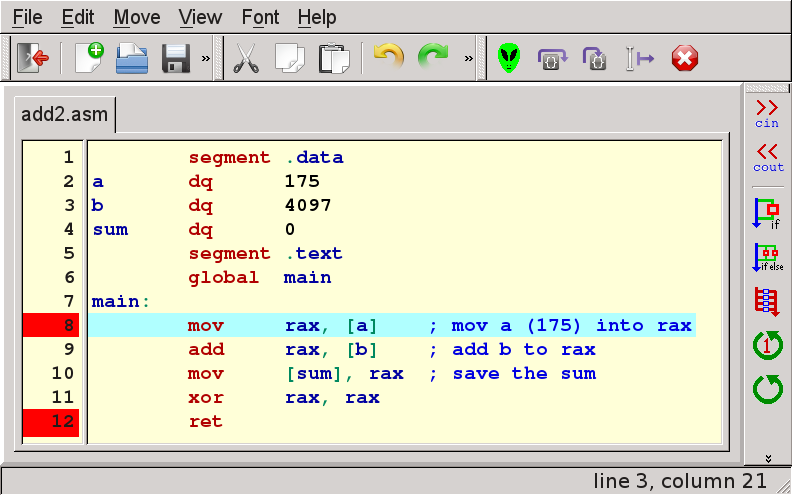
To the left of the source code in the ebe source window is a column of line numbers. You can see that lines 8 and 12 are highlighted with a red background which indicates that breakpoints have been set on these 2 lines. You can set a breakpoint by clicking with either the left mouse button on the line number for the breakpoint. You can clear a breakpoint by clicking again on the same line number.
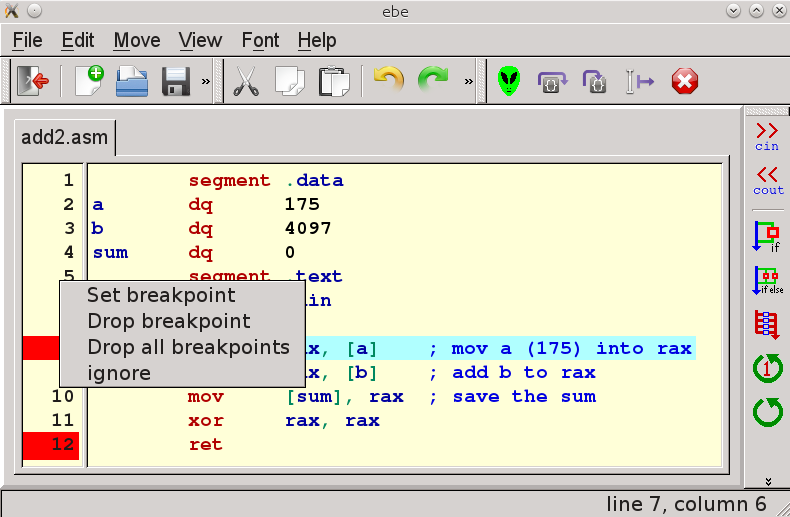
If you click with the right mouse button on a line number the breakpoint menu will pop up. To the right you can see the breakpoint menu. You could use the menu to set or drop a single breakpoint by right clicking on a particular line. You can also select "Drop all breakpoints" to wipe them all out at once. Realistically only the "Drop all breakpoints" is tempting, since a left click will set or clear a single breakpoint more easily than using the menu. There is also an "ignore" option in case you read the menu and decide you don't want to change any breakpoints.